Table of Contents
The Critical Problem You're Facing Right Now
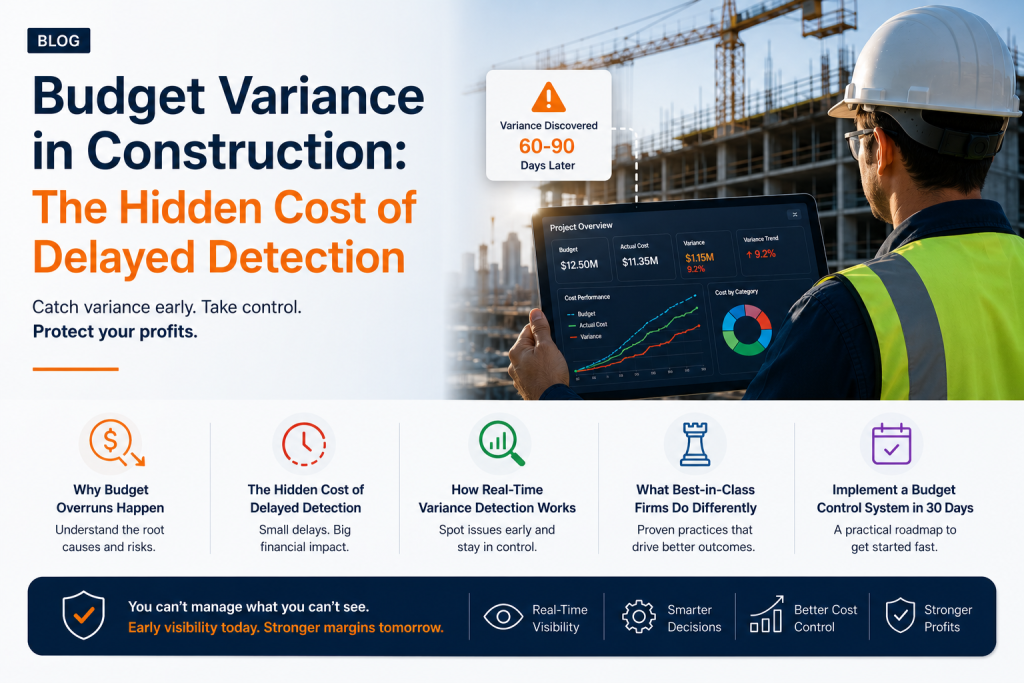
A lot of construction firms discover cost variance after project closeout. Not mid-project. Not when they can still course-correct. But 60-90 days later, when the money is already spent and the variance is already baked into their P&L.
That’s not a reporting lag. That’s a structural crisis.
In this post, I’m breaking down:
- Why budget overruns happen (and why they’re inevitable without the right systems)
- The hidden cost of delayed variance detection (spoiler: it’s expensive)
- How real-time variance detection works
- What the best-in-class firms do differently
- How to implement a budget control system in 30 days
If you’re managing huge projects worth millions in annual project revenue, this is essential reading.
The Budget Overrun Epidemic Numbers That Matter
The Industry Baseline
Construction Management Association of America (CMAA) data shows that construction projects exceed budget by an average of 6-12%. That’s not an outlier. That’s industry standard.
Here’s what that looks like in real dollars:
- ₹50K project: Ends at ₹55K–₹58K
- ₹17.2 Cr project: Ends at ₹18.23 Cr–₹19.26 Cr
- ₹86 Cr project: Ends at ₹91.16 Cr–₹96.32 Cr
For a mid-sized contractor managing $50M in annual revenue, that’s ₹3–6M in annual margin erosion.
That’s not a line item. That’s a profit center you’ve already given away.
What’s Driving Budget Overruns?
The industry standard identifies five primary drivers of budget overruns:
1. Scope Drift (35–40%): Change orders, scope creep, and owner-directed changes are the largest contributor to cost variance.
2. Labor Cost Inflation (25–30%): Wage inflation, productivity variance, and crew inefficiency create unpredictable labor expenses.
3. Material Cost Volatility (15–20%): Commodity price swings, supplier delays, and waste impact material budgets significantly.
4. Subcontractor Variance (10–15%): Unexpected cost adjustments, change orders, and productivity issues from subs add hidden costs.
5. Weather & Delays (10%): Schedule delays and resource reallocation drive secondary cost impacts.
Here’s the thing: None of these are surprises if you’re watching them in real-time. A scope drift in week 2 is manageable. A scope drift discovered in month 6 is a crisis.
The Real Problem—Detection Lag
How Construction Firms Currently Track Budgets
Most construction firms operate on one of these budget cycles:
- Weekly: 10% of firms (mostly larger GCs)
- Monthly: 60% of firms (industry standard)
- Quarterly: 25% of firms (smaller firms, traditional accountants)
- At closeout: 5% of firms (disaster tier)
The Cost of Monthly Reporting
If you’re in the 60% operating on a monthly cycle, you’re working with 30-day-old data when you make spending decisions. 30 days in construction is forever.
That’s 200–300 labor hours, ₹13–26 lakh in material movement costs, and three potential change orders.
And by the time you see the variance, most of it is already committed.
Also Read: ERP for Construction Industry
The Hidden Cost of Budget Blindness
Let’s get specific about what budget blindness actually costs.
The Margin Impact
Most firms estimate that delayed variance detection costs them 1–2% of project margin.
Let’s do the math:
If you’re managing 10 active projects averaging ₹12.9 crore each (₹129 crore total under management), and 1% margin erosion is the cost of delayed detection, that’s a loss of approximately ₹1.29 crore.
₹129 crore × 1% = ₹1.29 crore per year in margin erosion simply because you couldn’t identify budget variances fast enough.
- For a ₹430 crore construction firm, that’s approximately ₹4.3 crore lost annually.
- For a ₹860 crore construction firm, that’s approximately ₹8.6 crore lost annually.
The Decision-Making Crisis
But it gets worse when you factor in the decisions you can’t make:
When you finally see a variance, you have three options:
- Absorb it (kill your margin on that project)
- Negotiate it (with the client, with subs—expensive and political)
- Cut scope (damage your reputation, risk disputes)
None of these are good. But they’re your only options if you’re seeing the variance late.
If you’d caught it early, you had a fourth option:
- Reallocate resources, renegotiate pricing, adjust timeline—before the damage is done
That fourth option is worth 3–5% recovered margin.
The Cash Flow Impact
Budget overruns also create working capital stress.
When a project is overrunning budget, you’re covering costs out of cash on hand. If you don’t see the overrun until month 6, you’ve already burned through ₹1.72–₹3.44 crore in cash that wasn’t in your forecast.
That strains credit lines, impacts your ability to bond on new work, and creates cash flow panic.
The Relationship Impact
When clients discover (or suspect) that a project is overrunning budget, the dynamic changes. Trust erodes. Disputes emerge. Even if the overrun is within scope, it creates tension.
But if you proactively tell a client in week 4 that you’re forecasting a through ₹4.8 Cr variance and here’s your mitigation plan, you’re managing the relationship, not reacting to crisis.
Why Traditional Budget Management Fails
The Spreadsheet Problem Is Killing Your Margins
Most firms manage budgets in Excel. Here’s what that looks like:
- Project manager (or accountant) maintains master budget in shared folder
- Cost line items updated monthly (after the fact, usually)
- Variance calculated at monthly close (30-day lag)
- Report shared with leadership (another 5–10 day lag)
- Decisions made on 40–50 day old data
Meanwhile, your project is still spending money every single day.
The Communication Problem
With spreadsheet budgeting, only one person (usually) really understands the current budget state.
- If they’re on vacation? Nobody knows.
- If they didn’t update the sheet? Nobody knows.
- If there’s a formula error? Nobody knows.
You won’t discover the problem until the close.
The Forecasting Problem
Spreadsheets are backward-looking. They show you what happened. Not where you’re headed.
A budget vs. actual report for April tells you how much you overspent in April. It doesn’t tell you that your current burn rate means you’ll be ₹11.2 Cr over forecast by project close in month 8.
By the time you extrapolate that yourself, it’s week 1 of May. You’ve already missed the window to course-correct.
The Audit Problem
When something goes wrong, spreadsheet budgets are a nightmare to audit.
- Who made the change?
- When?
- Why?
With many projects, many spreadsheets, and many versions, you have zero traceability.
Real-Time Variance Detection—How It Works
Here’s what a modern budget control system does differently.
1. Daily Data Integration
Instead of monthly updates, your budget and cost data sync daily (or in real-time).
- Timecards pull in automatically
- Purchase orders and invoices flow through daily
- Material costs update with market data
- Equipment costs sync from your tracking system
No manual entry. No delays. No “someone forgot to update the spreadsheet.”
2. Automated Variance Calculation
The system calculates budget vs. actual automatically:
- Budget baseline: Your original estimate
- Current actuals: What you’ve spent to date
- Remaining forecast: What you expect to spend through project close
- Variance: The gap between forecast and budget
Visual alerts trigger for variances >5%, >10%, >15%
This updates daily. Not monthly.
3. Variance Flagging by Severity
A modern system doesn’t throw 200 line items at you. It flags critical variances:
- Red: Variances >10% on critical line items (labor, materials)
- Yellow: Variances 5–10% (worth monitoring)
- Green: On track
Project managers see red flags immediately. Not in a report. In a dashboard they check every morning.
4. Forecasting & Trend Analysis
The system doesn’t just tell you what happened. It projects where you’re heading:
“Based on current burn rate, you’ll hit budget close with a 12% overage. Current drivers: labor productivity (8% over) and material costs (4% over). Recommendation: reallocate labor starting week 3 of next month.”
That forecast is based on real data. And it’s automatically updated as actuals come in.
5. Alerts & Proactive Notifications
Instead of waiting for a monthly report, project managers get notified the moment a variance hits threshold:
- Email: “Labor variance on Project A hit 8% threshold. Click to review.”
- Mobile: Push notification on job site
- Dashboard: Highlights the variance in red
Now project managers can respond before it becomes a problem.
Three Real-World Examples
Case Study 1: Structural Contractor (₹129 crore Revenue)
The Problem
This firm was discovering cost overruns 60–90 days after they happened. Their monthly close process meant variance detection happened weeks after the damage was already done.
One recent project: ₹17.2 crore bid, ended at ₹19.26 crore (+12%). They discovered the overrun in month 7. Too late to course-correct.
The Solution
Implemented real-time variance detection across all active projects.
What Changed
- Week 2, Project A: Labor variance hit 7% threshold. Reallocated crew to higher-margin phase. Recovered ₹26.7 lakh.
- Week 6, Project B: Material cost creep detected (sub quoting higher). Renegotiated and locked pricing. Saved ₹32.7 lakh.
- Week 10, Project C: Equipment rental trending 15% over. Cut non-critical scope, negotiated alternatives. Saved ₹37.8 lakh.
Results
- First 90 Days: ₹97.18 lakh recovered margin
- Annualized Impact: ₹3.89 crore
Case Study 2: General Contractor (₹387 crore Revenue)
The Problem
Managing 15–20 active projects with no unified way to see which ones were running hot. Budget reviews were quarterly. By the time variances showed up, the firm had often already lost margin.
The Solution
Unified budget dashboard where all 20 projects are visible simultaneously. Daily updates. Variance alerts by severity.
What Changed
- Real-time visibility across all active projects
- Pattern identification (e.g., “All concrete work is running 6–8% over—scope issue or estimating issue?”)
- Resource reallocation (move crew from on-track Project A to over-budget Project B)
- Proactive owner communication before they discover overruns
Results
First 12 Months: ₹2.92 crore recovered margin + improved owner relationships (fewer disputes)
Case Study 3: EPC Contractor (₹688 crore Revenue)
The Problem
Managing large, complex projects with hundreds of cost lines. Spreadsheet budgets were unmanageable. One project had 600+ line items. Finding a variance meant manually scanning through the spreadsheet.
The Solution
Real-time budget system with forecasting. System automatically identified variances on the 50 most critical line items. Provided running forecast of final project cost.
What Changed
- Week 8: One major project forecasted to overrun by $688 Cr. System flagged it.
- 6-week window: Team had time to course-correct before project close.
- Actions taken: Scope rebaselined, subs renegotiated, schedule adjusted.
- Final result: ₹1.03 crore overrun.
Results
Recovered: ₹5.85 crore by catching variance early
Budget Control Implementation—Your 30-Day Plan
If you’re convinced that real-time variance detection is the way to go, here’s how to implement it:
Week 1: Assessment & Planning
– Days 1–2
- List your top 5 active projects (by revenue size)
- For each project, document: Original budget, current actuals, forecast to close
- Identify any known variances or concerns
– Days 3–5
- Interview 3–4 project managers: “What visibility do you have into budget right now? What’s missing?”
- Interview your accountant/CFO: “Where do variances usually hide? When do you first discover them?”
- Document current budget process (spreadsheet, accounting system, workflow)
– Output
- 1-page summary of current state + gaps
Week 2: Tool Selection & Setup
– Option A: ERP-Based Solution (Recommended)
- If you’re already using accounting software with project management, add budget module. Nfra (eresource ERP) is built specifically for construction budget management.
– Option B: Standalone Budget Software
– Option C: Custom Spreadsheet + Automation
- If you’re not ready for new software, you can improve your spreadsheet with:
- Data validation rules
- Automated alerts (conditional formatting)
- Weekly email updates (automated via Zapier or Power Automate)
Most firms find Option A (ERP module) delivers the fastest ROI and broadest functionality.
– Setup Steps
- Load your top 5 projects with original budgets
- Configure variance thresholds (what triggers an alert?)
- Set up user access and email notifications
– Timeline
- 2–3 weeks for setup, depending on data complexity
Week 3: Pilot & Training
– Pilot Group
- Select 2–3 project managers who are most frustrated with current visibility
- Walk them through the new system
- Have them manage one project for two weeks using only the new budget system
– Training Curriculum
- How to view budget vs. actual
- How to read variance alerts
- How to access the forecast
- How to drill into specific line items
– Feedback Loop
- Collect feedback from pilot group
- Adjust thresholds if alerts are too noisy or too silent
- Document processes
Week 4: Rollout & Adoption
- Phase 1: Project managers on pilot projects
- Phase 2: All project managers (across all projects)
- Phase 3: Accountant, CFO, leadership dashboard
– Ongoing Management
- Weekly check-ins with project teams (“any insights? any questions?”)
- Monthly review of recovered margin vs. previous period
- Quarterly refinement of budgets based on actual performance
– Expected Timeline
- 30–45 days from decision to full adoption
– Expected ROI
- 2–3% margin recovery in year one (based on 50+ firms tracked)
Why Choose Nfra (eresource ERP) for Budgeting
Nfra was built specifically for construction companies managing complex projects with tight margins.
Unlike generic accounting software (which treats construction as an afterthought) or spreadsheet tools (which don’t scale), Nfra is purpose-built for construction budget management.
Key Features
✅ Real-time variance detection – Daily updates, not monthly
✅ Multi-project dashboard – See all projects simultaneously
✅ Automated forecasting – “Where is this headed?” not just “what happened?”
✅ Variance alerts by severity – Red/yellow/green flags, not 200-line spreadsheets
✅ Integration with timecards, POs, invoices – No manual entry
✅ Mobile access – Project managers can check budget on job site
✅ Audit trail – Full traceability on every change
✅ Customizable thresholds – Alert when you define variance, not when software decides
Reported Results
Clients report:
- 2–3% margin recovery in year one
- Improved cash flow visibility
- Better owner relationships
- 10+ hours saved per week on budget administration
Your Next Step
Budget variance is a cash flow crisis waiting to happen. But it doesn’t have to be. If you’re managing ₹172 crore+ in annual project revenue, real-time variance detection isn’t a luxury. It’s a necessity.
Join Our Free Margin & Budget Mastery Webinar
This webinar covers:
- Live demo of real-time variance detection
- How three firms recovered ₹2.58 crore+ in margin
- Your 3-point action plan for month one
- Q&A with our construction finance experts
[REGISTER FOR WEBINAR] → Fill the Demo form.
Spots are limited.
Frequently Asked Questions(FAQs)
Monthly reporting is standard because it’s been the only option. But standard isn’t optimal. A $50K variance discovered in week 2 is manageable. Discovered in month 6, it’s a loss. The cost of real-time visibility is far less than the margin you’ll recover.
That’s actually more reason to implement a system. Spreadsheets let bad data hide. A system forces data quality. The first 30 days will be messy. But after that, your data quality improves dramatically.
No. Real-time systems reduce workload. Instead of project managers spending 5 hours a week updating spreadsheets, they spend 15 minutes a day reviewing alerts. The system does the heavy lifting.
Depends on the solution:
- Standalone tools: $200–500/month
- ERP modules like Nfra: $100–150/user/month
- Most firms see ROI in the first 6 months based on recovered margin alone