Table of Contents
Introduction: Data Is Everywhere, Nowhere That Matters
In construction and project-based businesses, data is everywhere. On spreadsheets. In field devices. In accounting software. In project management tools. But here’s the problem: it’s nowhere that matters.
When your finance team, field managers, and project managers can’t see the same data, decisions become guesses. Opportunities slip past. Cost overruns go unnoticed until they’re catastrophic.
This guide shows you how data integration breaks silos, accelerates decisions, and saves money.
Quick Stats: The Cost of Data Silos
| Metric | Figure |
|---|---|
| Average decision delay | 14 days (due to multi-system data gathering) |
| Unreported cost overruns | 23% of projects exceed budget before notice |
| Lost accountability | 67% of firms can’t trace who made what change |
| ROI of integration | 40% faster decisions, 30% reduction in cost variance |
Section 1: The Data Siloing Problem
What is data siloing?
Data siloing happens when different departments store information in separate systems with no way to access or share it. Finance has cost data. Field has progress data. PM has schedule data. Each team sees a different picture of the same project.
The result: Incomplete information. Slow decisions. Repeated mistakes.
In construction, this happens almost by default. Finance uses QuickBooks or NetSuite. Field uses mobile timesheets or paper logs. Project managers track schedule in Excel or specialized PM software. Nobody talks to anybody. Data stays trapped in systems.
Section 2: Where Silos Actually Form
Finance Department
Tracks: Cost allocations, PO approvals, invoice matching, financial reporting.
Their truth: monthly actuals vs. budget.
Problem: No visibility into field delays or scope changes that caused the variance. They see the ₹38 lakh overrun but have no idea why.
Field Operations
Tracks: Labor, material consumption, progress photos, daily reports.
Their truth: what actually happened on-site.
Problem: No formal integration with cost tracking. If a material delay happens, it doesn’t automatically update the schedule or cost forecast. It’s logged verbally or in an email.
Project Management
Tracks: Schedule, scope, milestones.
Their truth: are we on time?
Problem: They don’t own cost tracking (that’s finance). They don’t control field labor allocation (that’s operations). So when a scope change happens, they change the schedule but not the cost impact, leaving finance blind-sided.
Also Read: ERP for Construction Industry
Section 3: The Real Business Cost of Disconnected Systems
1. Decision delays add up fast
When a cost variance appears, you have to:
- Wait for finance to flag the discrepancy
- Request field data from the site manager
- Cross-reference with PM schedule
- Schedule a meeting to discuss
- Make a decision
This takes 10–14 days. By then, the problem has compounded. Materials have been ordered at higher cost. Labor is allocated inefficiently. The client notices delays.
2. Poor accountability creates blame-shifting
When nobody can see the complete data trail, accountability disappears. “I didn’t know” becomes the default answer. Finance blames field. Field blames the PM. PM blames the change order. Nobody owns the problem. It gets repeated.
3. You miss interventions until it’s too late
With real-time integrated data, you’d catch a cost overrun after day 3 of a delay. You’d adjust resource allocation, negotiate material delivery, or re-sequence work before the damage spreads. Instead, you discover the problem 2–3 weeks later when it’s already cost you tens of lakhs.
Section 4: What Data Integration Actually Means
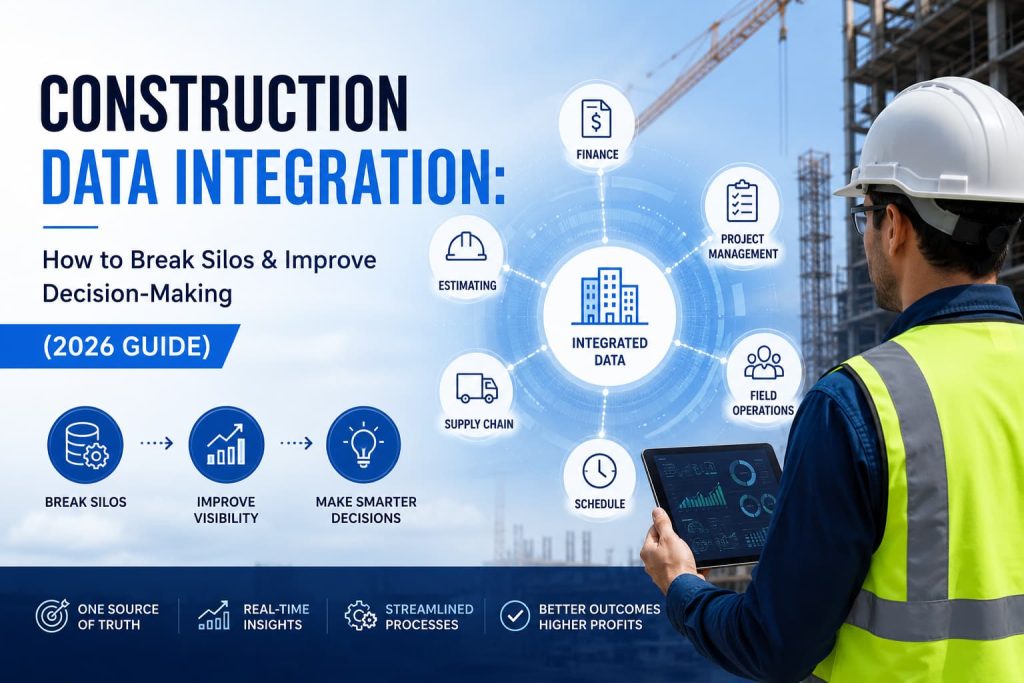
Data integration doesn’t mean forcing everyone into one monolithic system. It means creating a single source of truth where all departments—finance, field, PM, supply chain—see the same current data.
What it looks like:
- Finance sees a cost report that includes real-time field labor, material consumption, and schedule variance
- Field managers input progress data once, and it automatically updates the cost forecast and schedule
- PM changes a scope item, and finance immediately sees the cost impact
- Supply chain tracks material orders in the same system, so cost updates happen automatically
- Every change is logged with a timestamp and user ID, creating a complete audit trail
Data integration is about synchronization, transparency, and accountability.
Section 5: Real-Time Data Synchronization
The biggest advantage of integration: real-time updates. When a field team logs material costs, it’s immediately reflected in the project’s cost forecast. When PM approves a scope change, it updates the schedule and budget simultaneously.
This means dashboards that actually tell the truth. Reports that don’t take 3 days to compile. Decisions made on current information, not yesterday’s data.
For a construction firm managing 5–10 concurrent projects, real-time sync can reduce decision cycles by 50–70%.
Section 6: Audit Trails & Complete Accountability
An integrated system records every change: who made it, when, why. This isn’t just for compliance. It’s business intelligence. When a cost overrun happens, you can trace exactly what changed, in what order, and who approved it.
This eliminates blame-shifting. It makes accountability real. And it forces better discipline in your organization because everyone knows their actions are recorded.
Audit trails also speed up disputes. If a client questions a change order, you have documented proof of exactly when it was approved and by whom.
Section 7: Cross-Functional Reporting
Integrated systems enable reports that make sense to the entire organization. A report that combines cost actual vs. budget with schedule variance and field progress tells the whole story. Finance understands why a cost overrun happened (schedule delay). Field understands the financial impact of their decisions.
This alignment is powerful. Departments stop working against each other. They start working toward the same metrics.
Example report: “Project X has a 5-day schedule delay (costs ₹14.25 lakh in labor) and a ₹7.6 lakh material variance (supplier shortage). If we expedite delivery (+₹2.85 lakh), we can recover 3 days and save ₹8.55 lakh total.” Everyone sees the same numbers and can agree on the solution.
Section 8: Decision Acceleration
The ultimate benefit: faster, better decisions. When information is complete and current, decisions don’t require meetings with 5 departments. An operations director can spot a cost variance on a Monday dashboard and take corrective action by Wednesday. That’s a 50% improvement in decision speed.
And faster decisions directly translate to smaller losses.
A 2-week delay in correcting course might cost you ₹47.5 lakh. A 2-day correction might cost you ₹4.75 lakh. That’s an order-of-magnitude difference.
Section 9: Case Study – Real-World ROI
Company: Mid-sized commercial construction firm (annual revenue ~₹427.5 crore)
Challenge: Finance, field, and PM data lived in three systems. Cost overruns were discovered 2–3 weeks after they occurred. The CFO spent 40% of his time manually reconciling data. Decision cycles for corrective action took 10–14 days.
Solution: Implemented an integrated workspace where all project data—costs, schedule, field progress—synced automatically.
Results (Year 1):
| Metric | Result |
|---|---|
| Decision cycles | 14 days → 3 days (78% improvement) |
| Cost variance detection | Within 2–3 days (instead of 2–3 weeks) |
| CFO time on reconciliation | 40% → 8% |
| Project margin improvement | +2.1% (reduced cost variance and faster interventions) |
| ROI | ₹11.4 crore recovered vs. ₹2.66 crore cost = 330% ROI in Year 1 |
Key insight: The firm wasn’t able to avoid cost overruns. But they caught them much faster, which meant smaller losses and better client relationships (fewer surprises at close).
How to Implement Data Integration
- Step 1: Map Your Current Data. Where does each department store data? What’s in each system? Where are the gaps? This audit takes 2–4 weeks but prevents costly missteps later.
- Step 2: Define Your Single Source of Truth. What metrics matter? (cost actual, schedule variance, field progress, supply chain status). Who owns each metric? How should departments access it?
- Step 3: Choose a Platform. An integrated ERP that includes project accounting, field management, and PM capabilities (rather than stitching together 3 systems).
- Step 4: Pilot on One Project. Roll out on a small project first. Identify issues, train teams, refine workflows. Use this to build a strong business case for full rollout.
- Step 5: Full Rollout & Optimization. Once pilot is successful, roll out to all projects. Continuously optimize based on user feedback and business results.
Final Thoughts
Data siloing is not a problem you solve once. It’s a structural challenge that requires the right systems, processes, and discipline. But firms that get it right gain a massive competitive advantage: faster decisions, better margins, happier clients.
Your competitors who haven’t integrated yet are still losing weeks and lakhs of rupees on every cost overrun. If you integrate today, you’ll be spotting problems in days—and solving them faster than they can even see them coming.
Ready to break the silos? Nfra’s Integrated Workspace brings finance, field, project management, and supply chain into one system. See the whole picture. Make better decisions. Recover lost margin.

Nfra's Integrated Workspace brings finance, field, project management, and supply chain into one system.
Make better decisions. Free Webinar
Frequently Asked Questions(FAQs)
Data siloing is when departments store information in separate systems that can’t share it—finance has cost data, field has progress data, and PM has schedule data. Each team sees a different picture of the same project, leading to incomplete information, slow decisions, and repeated mistakes.
Silos drive roughly 14-day decision delays, let 23% of projects exceed budget before anyone notices, and leave 67% of firms unable to trace who made what change. Integration typically delivers 40% faster decisions and a 30% reduction in cost variance.
It doesn’t mean forcing everyone into one monolithic system. It means a single source of truth where finance, field, PM, and supply chain all see the same current data—field progress updates the cost forecast automatically, a scope change shows its cost impact instantly, and every change is logged with a timestamp and user ID.
When field teams log costs or PM approves a scope change, the cost forecast, schedule, and budget update simultaneously. For a firm running 5–10 concurrent projects, real-time sync can cut decision cycles by 50–70%.
A mid-sized firm with about ₹427.5 crore in revenue cut decision cycles from 14 to 3 days, caught cost variances in 2–3 days instead of 2–3 weeks, freed the CFO from 40% to 8% reconciliation time, and gained +2.1% margin—₹11.4 crore recovered against ₹2.66 crore cost, a 330% first-year ROI.