One ERP. Every Industry. Global Presence. Powered by Azaalea AI

One ERP. Every Industry. Global Presence. Powered by
Smart Multi-Dimensional
Reporting
Analyze From Every Angle
Unlimited
Dimensions
Real-Time
Analytics
Zero Code
Configuration
Unlimited
Dimensions
Real-Time
Analytics
Zero Code
Configuration
⭐ Powered by Azaalea
Traditional ERPs lock you into rigid reports with fixed groupings. But with eresource’s multi-dimensional reporting, you can instantly pivot data, filter on any combination of parameters, and dive deep into performance metrics across multiple perspectives.
Multiple Dimensions
Analyze data by customer, project, location, department, cost center, or any custom dimension your business requires.
Instant Pivoting
Switch between different views and groupings with a single click. Transform rows to columns and vice versa effortlessly.
Advanced Filtering
Apply complex filters and nested conditions to focus on exactly the data subset you need to analyze.
Dynamic Visualizations
Convert reports into interactive charts, graphs, and dashboards that update in real-time as data changes.
Reporting Engine Capabilities
Drag & Drop
Report builders
Live Data
Real-time updates
Drill-Down
Transaction level
Export
Multiple formats
How Smart Multi-Dimensional Reporting Works
Here’s how our advanced reporting capabilities help you take full control of your KPIs and turn complex data into actionable insights.
Capture Data with Context-Rich Dimensions Multi-dimensional tagging
Every transaction in eresource ERP can be tagged with multiple dimensions—like Customer, Project, Department, Location, Cost Center, Profit Center, Employee, or custom tags unique to your business.
Flexible Report Builders Drag-and-drop design
Use drag-and-drop report designers to select any combination of dimensions as rows or columns, apply filters to focus on specific regions, teams, projects, or periods, and aggregate data in real-time.
Dynamic Drill-Down Interactive exploration
Start with high-level KPIs, then click to drill down into transactions, invoices, or journal entries supporting each figure. Understand exactly where, why, and how numbers move.
Smart Visualizations Interactive charts
Transform reports into interactive charts, graphs, and dashboards. Compare sales by region vs. sales by project with a single click, visualize profit margins by customer segment.
Export & Share Seamless sharing
All reports and dashboards can be exported to Excel, PDF, or shared internally through secure links. Set up automated email schedules to keep stakeholders updated without manual effort.
Real-Time Data Live updates
Reports are always up-to-date with the latest transactions—no need for batch refreshes or offline data processing. Make decisions with confidence, knowing you’re seeing live numbers.
💡 Performance Note
Reporting performance may vary based on data volume, complexity of filters, and hardware resources. Our solution scales to handle large data sets with optimized queries and indexing.
See Smart Reporting in Action
Experience the power of multi-dimensional reporting with our advanced analytics interfaces designed to make complex data analysis simple and intuitive.
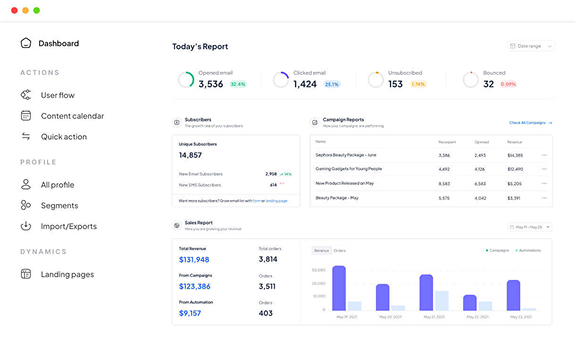
Multi-Dimensional Dashboard
Interactive dashboards with real-time KPIs, filters by multiple dimensions, and drill-down capabilities. Visualize your business performance from every angle with dynamic charts and graphs.
- Real-time KPIs
- Interactive filters
- Drill-down Analytics
- Custom Widgets
Advanced Analytics Screen
Powerful analytics interface with pivot tables, dimension selectors, and complex data analysis tools. Switch between different views and perform in-depth analysis of your business data.
- Pivot tables
- Dimension Analysis
- Data Comparisons
- Trend Analysis
Visual Report Builder
Intuitive drag-and-drop report builder that lets you create custom reports without coding. Select dimensions, apply filters, and generate professional reports in minutes.
- Drag-and-drop design
- Custom dimensions
- Filter builder
- Export options
Ready to Transform Your Reporting?
See how eresource ERP’s Smart Multi-Dimensional Reporting can revolutionize the way you analyze and understand your business data.
Technical Advantages of Multi-Dimensional Reporting
Built on advanced analytics architecture with enterprise-grade capabilities that scale with your data volume and complexity requirements.
Unlimited Dimensions
Supports unlimited user-defined dimensions—no restriction to fixed structures. Create custom tags and categories that match your unique business needs.
Integrated Security
Built-in security ensures users only see reports relevant to their roles. Row-level security and field-level permissions protect sensitive data.
Dashboard Studio
Compatible with eresource Dashboard Studio for personalized views. Create executive dashboards, departmental views, and role-specific analytics.
Advanced Filters
Advanced filters allow nested conditions (e.g., project in ‘East Region’ AND customer type ‘Corporate’). Build complex filter logic with ease.
Query Analyzer
Query Analyzer lets power users build custom SQL-based reports without affecting live operations. Advanced users get unlimited flexibility.
Real-Time Processing
All reports process live data with optimized queries and intelligent caching. No delays, no batch processing—just instant insights.
Technology Highlights
OLAP
Cube processing
In Memory
Fast analytics
Columnar
Optimized storage
Parallel
Query processing
Stop Guessing. Start Knowing
Contact us today to see how eresource ERP can revolutionize your reporting and turn your data into actionable business intelligence.
⭐Trusted by 500+ Companies
⭐24/7 Support
⭐98% Customer Satisfaction
Schedule Demo
Smart Multi-Dimensional Reporting in action with a personalized demo
Book Demo
Free Trial
Try our reporting tools with your own data for 30 days
Start Trial
Book Demo
Speak with our analytics specialists about your reporting needs
Talk to Expert
Transform how you understand your business with analytics that adapt to your unique needs.